Software and AI.
Amplifies whatever the three layers below are sending. If they’re sending noise, it amplifies the noise.
Run the 30-second check below. It names the trap you’d fall into. The full Pyramid Profile (10 min, free) names the kind of plant you run, where the leverage hides, and what to do Monday.
No sales sequence unless you opt in.
30-second check · No email required
We’ll name the trap. The expensive one is usually quieter.

The pattern · Loud vs. expensive
The loud one
It probably has a person. It almost certainly has a maintenance ticket. Cost is visible, owner is named, the next budget cycle will fix it.
The expensive one
Most plants invest where the noise is when the leverage sits in a quieter part of the system. The visible problem gets fixed. The quieter foundation gap compounds, and becomes next year’s loud one.
The Monday meeting · Everyone’s right
If you have been in a Monday morning meeting where everyone agrees the plant has problems and nobody agrees which one to fix first, you already know what this is.
Your CFO wants the cost case. Your maintenance lead wants the breakdown that ruined his weekend. Your operators want the procedure that contradicts the SOP. They are all right. Each of them is pointing at a real signal, from where they sit.
What the meeting can’t tell you is which part of the system is generating all three signals at once. That’s a leader’s call, and it’s the one the Pyramid Profile is built to make. Once you can name where the next dollar should go, the meeting changes. So do the projects coming out of it.
Origin · The 900HP motor
Scroll. Three beats. The story takes about 40 seconds to tell. It’s the reason 3AG starts every plant engagement with a diagnosis, not a tech recommendation.
01 · Cold morning
I’m Tim. About a decade ago I was an engineer at a plastics plant near Edmonton. I walked in, booted my computer, and Grant, the head millwright, was at my door. Our 900HP MAAG pump motor had failed overnight. The thrust bearing on the motor itself was gone, and the whole plant was down with it.
02 · The investigation
Mechanical cause: clear within days. The bearing failed because nobody had been acting on the data we already had. Vibration readings, collected. Temperature readings, collected. The trend showing the failure coming, visible days in advance, on a screen nobody was checking.
03 · The realization
The most expensive problem was the months of weak vibration-monitoring discipline that let the failure compound. Different layer. Quieter. We did not see it because we were not looking for it. I went back to school. Now I help plants like yours name which layer to push next.
What came of it
The Pyramid Profile is what came out of those years of asking, plant by plant, where the next dollar should go. It does not ask you about your current technology stack. It asks where the work actually stalls, then names what’s underneath.
The mechanism · Four layers, bottom-up
Amplifies whatever the three layers below are sending. If they’re sending noise, it amplifies the noise.
OEE, scrap rate, on-time delivery. The KPIs that have owners and targets. Plus the data plumbing underneath: taxonomies, downtime codes, sensors. Without that, the signal can’t be trusted.
Industry-standard practices, applied with discipline. Written procedures, documented changeovers, root-cause habits. The playbooks that survive when your best people leave.
People raise problems without fear. Leaders walk the floor. Improvement is safe, routine, and led.
Amplifies whatever the three layers below are sending. If they’re sending noise, it amplifies the noise.
OEE, scrap rate, on-time delivery. The KPIs that have owners and targets. Plus the data plumbing underneath: taxonomies, downtime codes, sensors. Without that, the signal can’t be trusted.
Industry-standard practices, applied with discipline. Written procedures, documented changeovers, root-cause habits. The playbooks that survive when your best people leave.
People raise problems without fear. Leaders walk the floor. Improvement is safe, routine, and led.
Read bottom-up. Each layer is enabled by the one below.
How the Profile works · 22 questions, ~10 minutes
You rate your plant on one question per layer, then we ask for evidence: what actually happens in the last 30 days. The gap between the rating and the evidence is the say-do gap. Usually where the next move hides.
What you get back
Archetype
The kind of plant you run. Not a score. A name.
Monday actions
5–7 actions tailored to where the leverage hides, and to your specific answers.
Per-layer scores
Culture, Methods, Metrics, Technology. Each scored 0–100. Visible say-do gap.
Tells
The patterns your archetype is most likely to recognize. If you don’t, the rest of the profile probably isn’t a fit.
Verbatim phrases
The things your team probably says. You’ve heard most of them this week.
Vendor-pitch warnings
The specific predator pitches you’re most likely to be sold this quarter, by archetype, and how to recognize them.
Three false beliefs
This sounds too generic for my plant.
The Profile outputs one of six archetypes, each with its own behavioral tells, vendor-pitch warnings, and Monday actions:
Foundation Builders · System Architects · Signal Seekers · Accelerators · Steady Hand · Strategists
A generic diagnostic gives you a score. This one gives you a name.
I already know what’s wrong with my plant. I don’t need a quiz.
You don’t take it for the score. You take it for the gap. Most leaders’ rating doesn’t survive the evidence question. That gap is the diagnostic.
My data is too messy for this.
The Profile is free. It takes 10 minutes. It requires no IT integration and no data from your systems. It produces a defensible diagnosis you can take to your CFO.
Two cases · diagnostic-first
Mining
Case 01
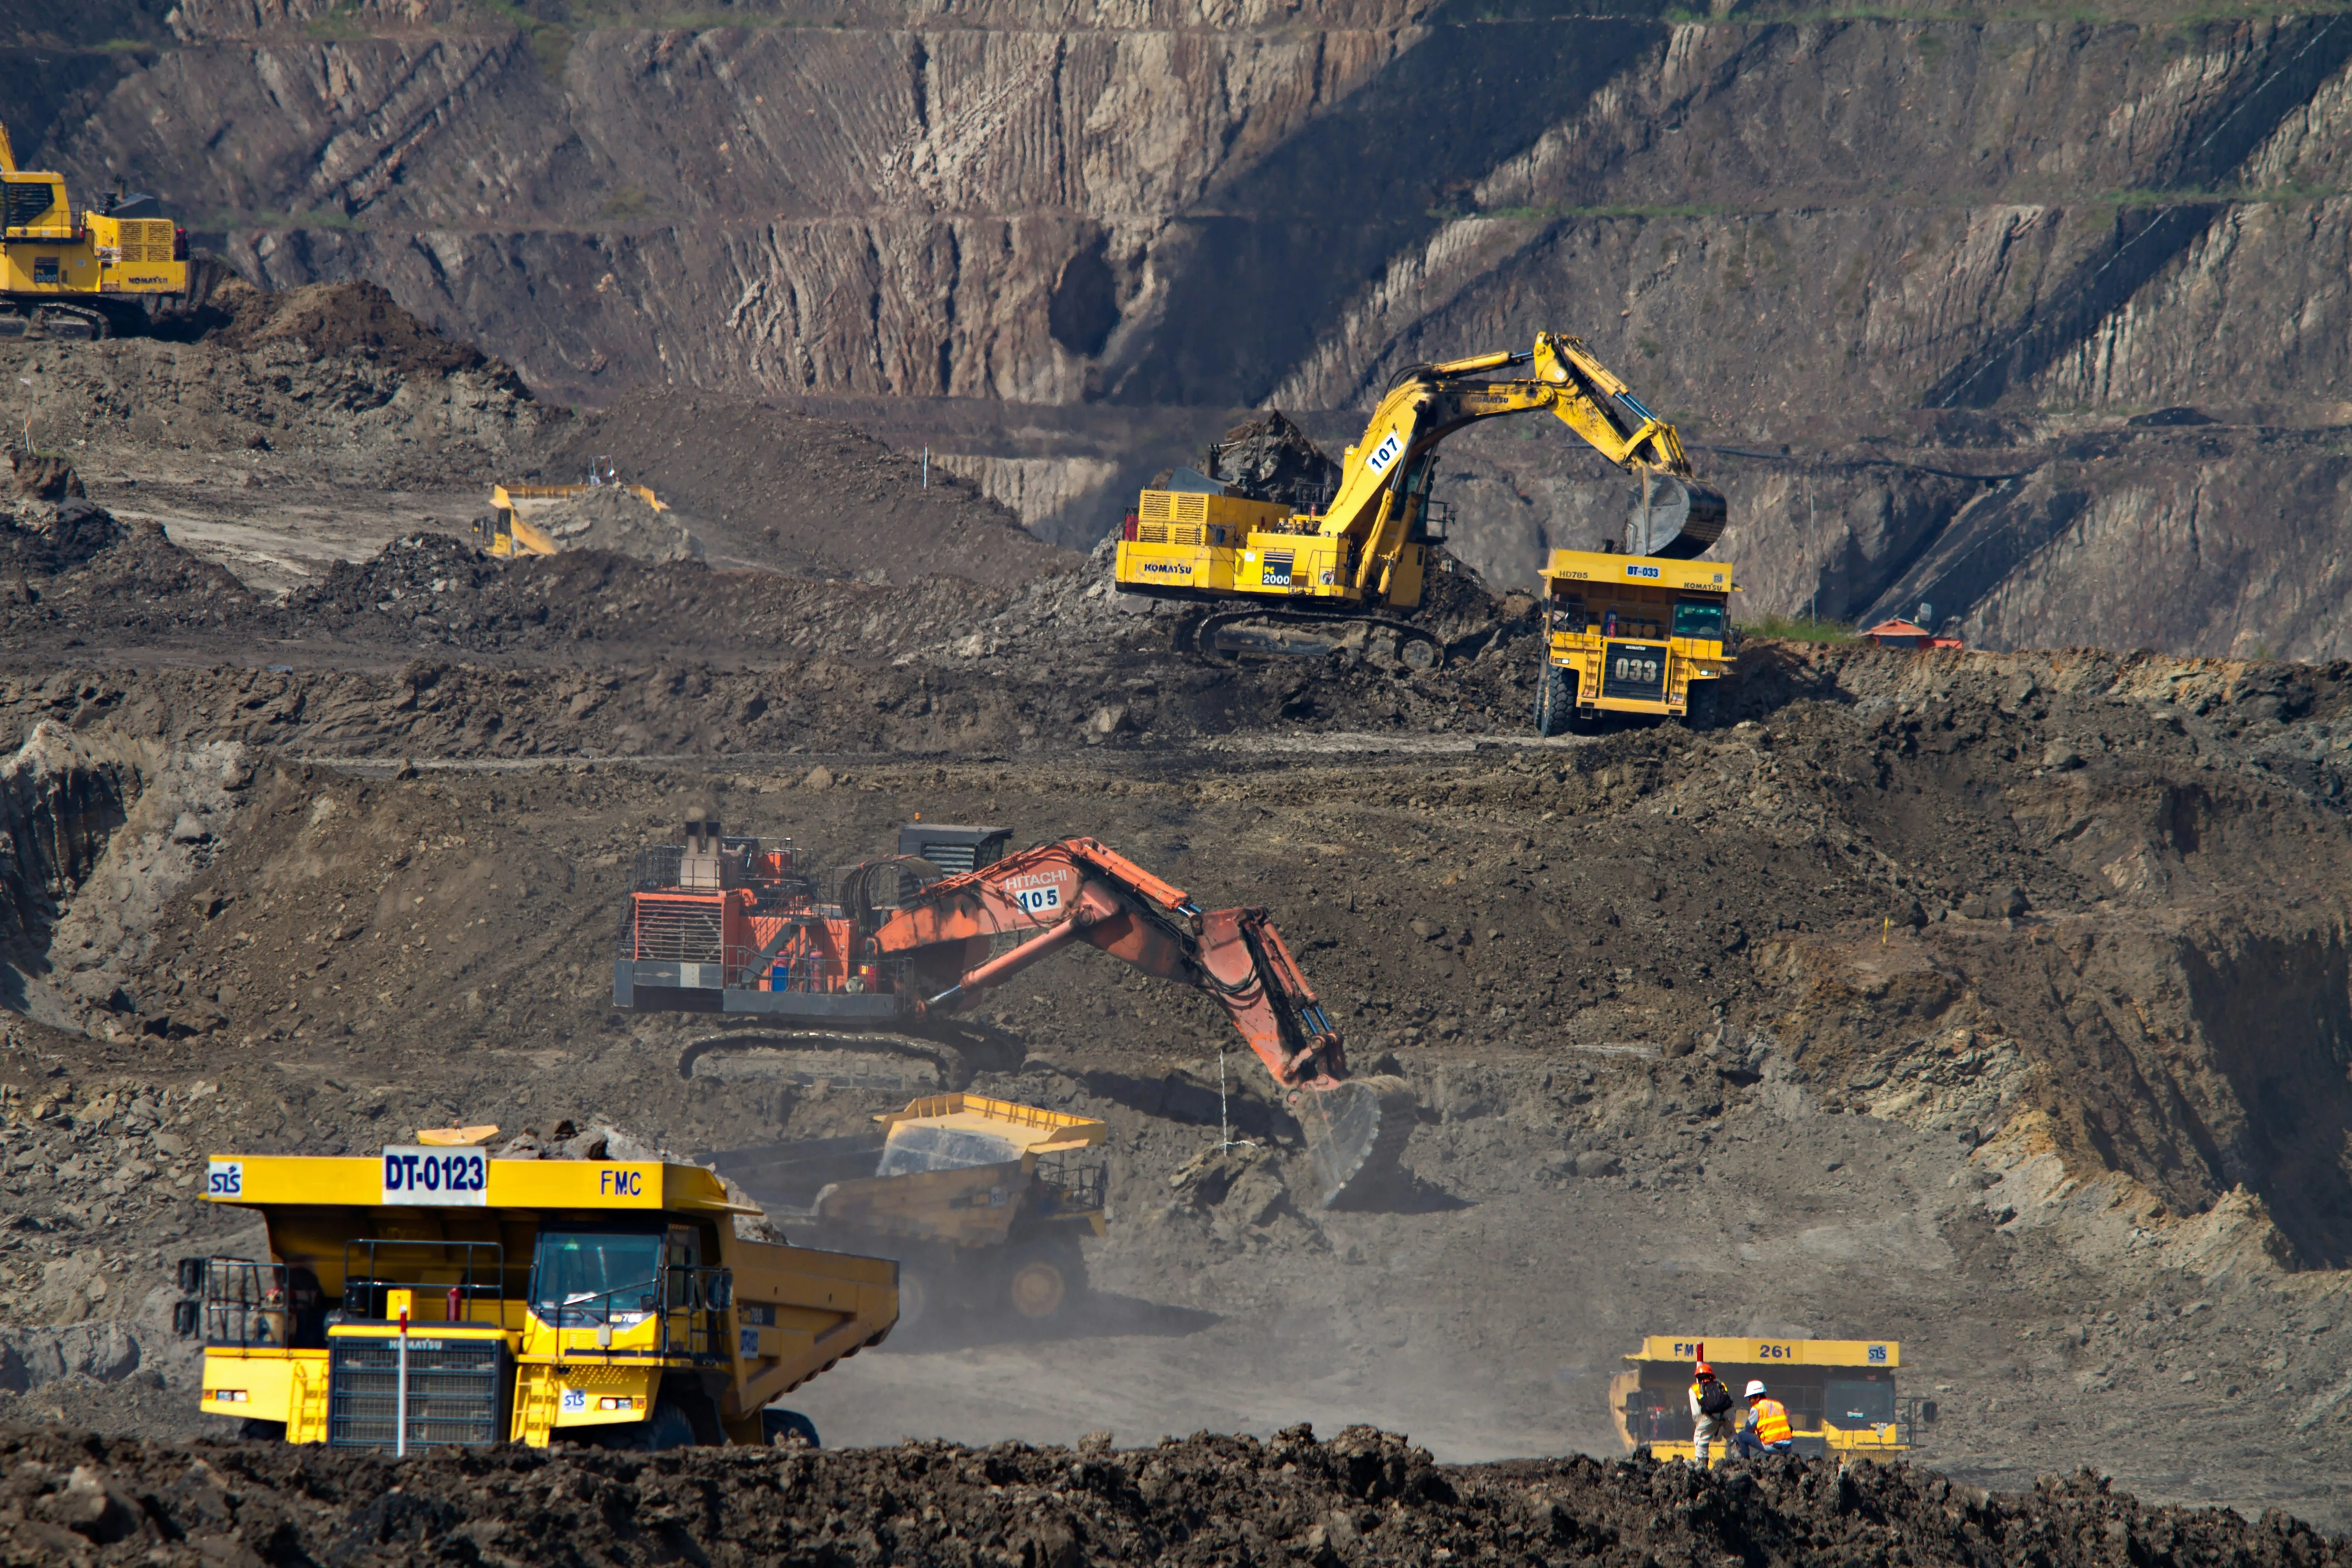
Equipment failures and unplanned downtime, scattered across two years of spreadsheets and shift notes. The ask was a dashboard. That’s Tech.
We built it. But not first. First we put the Methods underneath: OEE as a real discipline, TPM for maintenance. Both standard in industry, neither in use here. Methods then defined which Metrics actually mattered, so when the dashboard finally lit up, it was showing the right number.
And there it was. One piece of equipment, terrible uptime, nobody had thought to question. Roughly $1M a year, off the bottom line, year after year, no one looking.
The dashboard worked because the three layers underneath were doing their job.
Loud problem
Equipment failures
Expensive problem
One asset losing ~$1M/yr
Electronic chip
Case 02
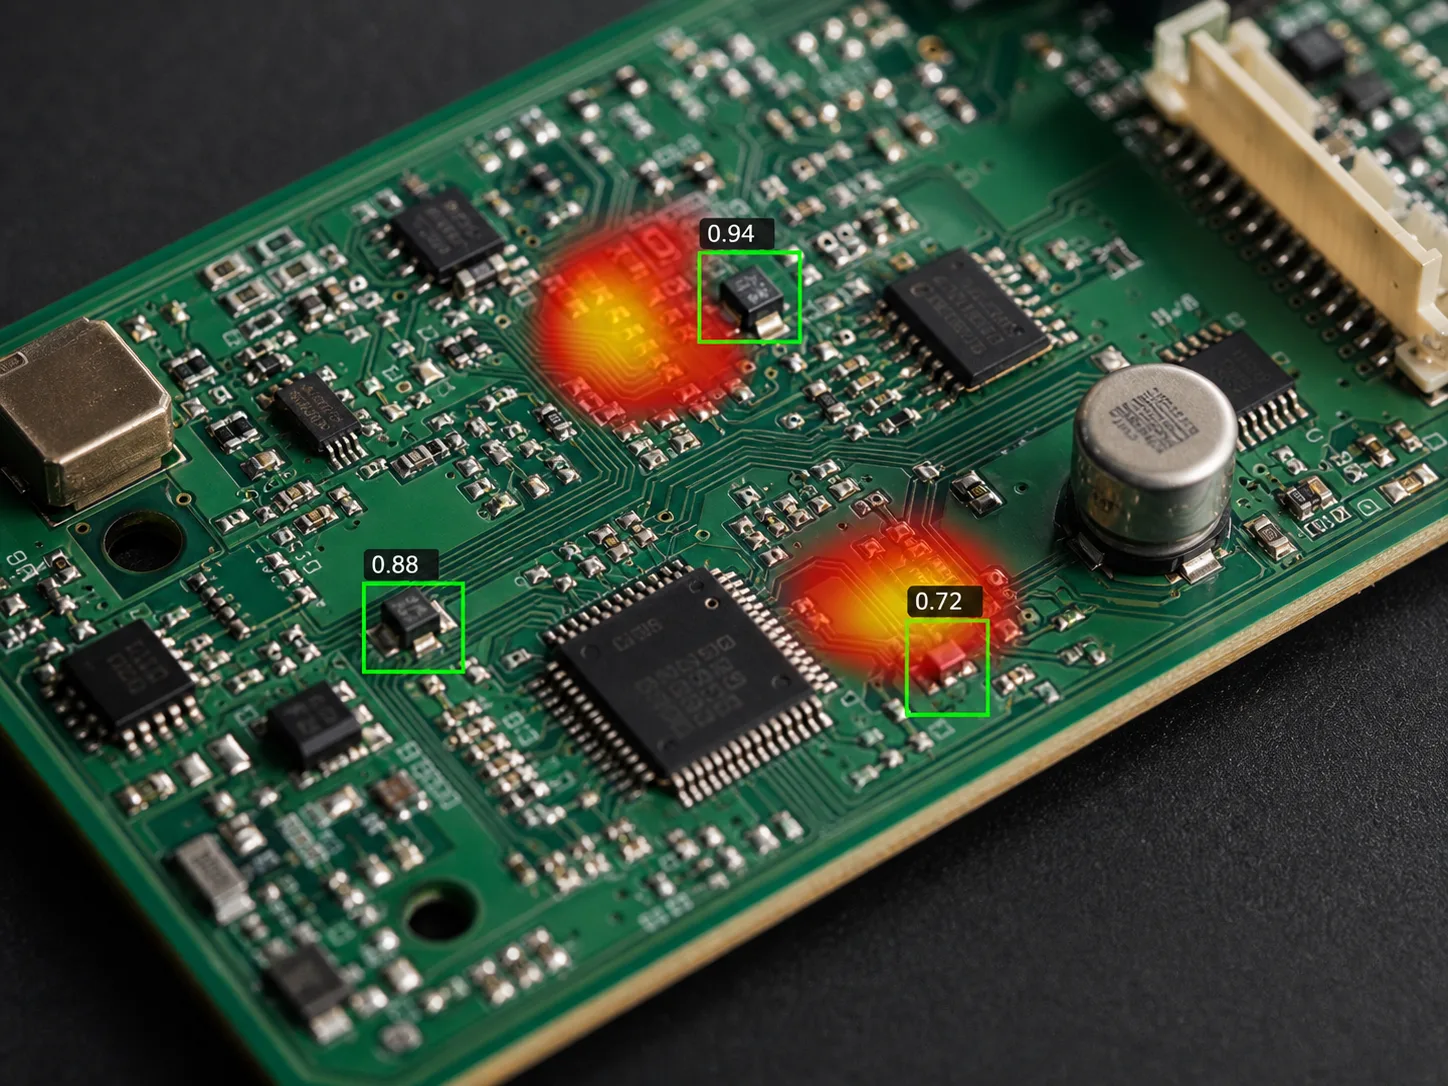
Operators were reviewing chips by eye, shift after shift. A bottleneck nobody could break on the floor. The team had inherited manual inspection as ‘how it’s done’ and never surveyed what the rest of the industry uses.
We pushed back on the ask. Before we built anything, we walked the team through what’s standard elsewhere: Automated Optical Inspection, defect taxonomies, labeled-data discipline. None of it was secret. None of it had been tried here.
Then we proved it. A short proof-of-concept on real production imagery showed computer vision could flag the defects. The Tech worked because the Methods work was done first, on purpose, by us. Not because the right answer was sitting there waiting.
Loud problem
Manual inspection bottleneck
Expensive problem
Industry-standard methods never tried
The stack · Free + optional
~22 Q · ~10 min · online · report emailed
Thirty minutes. No deck. Just whether we’re the right team.
No-pitch guarantee
The result page literally warns you about the predator pitches we will not be making to you.
Forwarded-PDF FAQ
Whether or not you ran the 30-second check
Ten minutes. Free. We email the report.